In 2008, (most) people all around the world were caught up in a rude shock as they see one of the worst financial crisis crashed upon the shores of their countries. Equity markets everywhere crashed, millions of jobs disappeared and banks all around the world had to be bailed out by governments. Even the British Queen (Elizabeth II) remarked: “why did nobody notice the “awful” financial crisis earlier?”
I was still in university when the 2008-2009 Global Financial Crisis (GFC) happened, and as such, I did not know what was really happening out there in the real world. Frankly, I recalled that even many intellectuals, so-called ‘experts’ and think-tanks back then couldn’t explain when the whole charade unfolded. But, what I do know is that the wealth and welfare of my family and friends were adversely affected, and I realised I cannot afford to be ignorant of the big world events from then on. I became increasingly interested in global finance, and my passion for world history, geopolitical affairs and macroeconomics meshed into a pursuit for global macro investing.
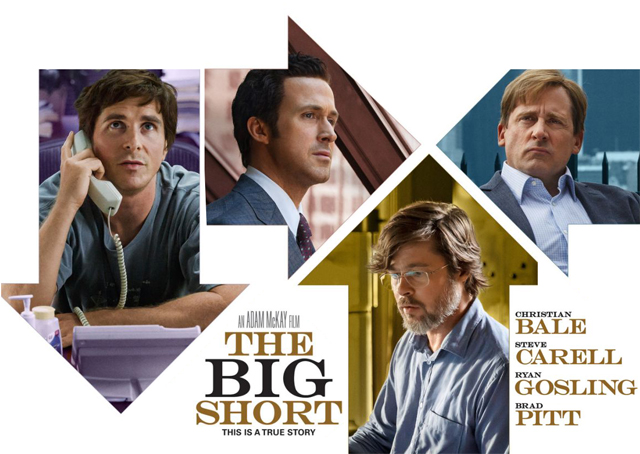
Many movies and books have been written about the GFC. And the recent movie ‘The Big Short’ is an interesting movie done in a documentary style (narrated by actor Ryan Gosling) on a bunch of guys betting heavily against the US housing bubble.
But here’s where things are getting serious: It’s been 8 years, and while the global economy has somewhat rebounded from those dark days, there exists a possibility of another ‘crisis’ materialising some time in the near-future. Why?
We are currently at the turning point of a debt supercycle (aka long-term debt cycle).
Most people have heard of business cycles or economic cycles, which is typically known as your cyclical fluctuations between an economic expansion and a contraction. It’s something we all know because we experience it constantly over the years and across the different phases of our lives. Terms such as ‘economic booms’, ‘recessions’, ‘job retrenchments’ all describe events that usually occur throughout an entire business cycle.
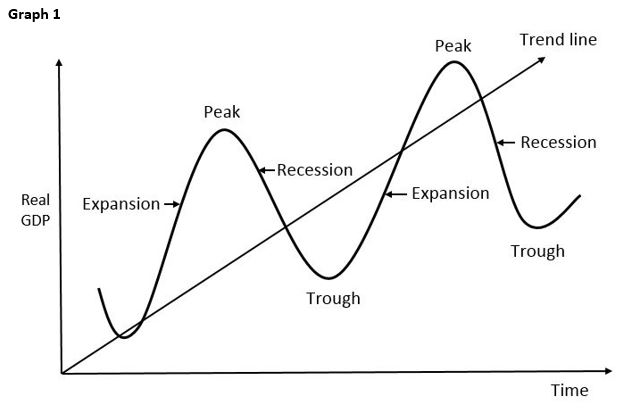 The illustration in the graph above is a textbook-style graphic that describes the business cycles that we are familiar with. However, there is another element to it, and its commonly known as debt.
When you purchase a good or service, you either fund it with cash or with debt. Borrowing money for a purchase and promising to return it to the lender creates credit. The bulk of purchases across the world is usually done via credit. Just think of your auto loans, mortgages, etc. Thus, it’s credit growth that drives the business cycle because spending and investment (on credit) creates economic momentum, which drives profitability and earnings and spurs job creation. When debt has to be eventually repaid, businesses and consumers have to commit more cash to settle their obligations, slowing economic momentum on aggregate as borrowing and spending decreases (and creating a debt cycle).
Central banks influence the business cycle because they control the cost of credit. They do so via shifting benchmark interest rates to influence the money supply in the economy. When interest rates are lowered, debt becomes cheaper which makes credit growth easier. Conversely when interest rates are raised, debt becomes costlier, which slows the generation of credit as businesses and consumers take on less debt. The cycle of credit generation across a business cycle is also known as the short-term debt cycle.
Now, if one takes a step back and look at the bigger picture of all these cycles just described, we get to see debt supercycles, or long-term debt cycles. These long-term debt cycles are essentially debt accumulation across several generations, and because they occur over periods of 50-70 years, it’s difficult for most people to actually conceptualise it, unlike the short-term debt cycle and the business cycle. And because they occur over a lifetime, most people have only experienced a segment of an entire long-term debt cycle.
These long-term debt cycles have existed since time memorial, and if you’re familiar with the book of Leviticus in the Bible, it was known as the Jubilee. It was a time of debt repayment:
“And thou shalt number seven sabbaths of years unto thee, seven times seven years; and the space of the seven sabbaths of years shall be unto thee forty and nine years. Then shalt thou cause the trumpet of the jubile to sound on the tenth day of the seventh month, in the day of atonement shall ye make the trumpet sound throughout all your land. And ye shall hallow the fiftieth year, and proclaim liberty throughout all the land unto all the inhabitants thereof: it shall be a jubile unto you; and ye shall return every man unto his possession, and ye shall return every man unto his family. A jubile shall that fiftieth year be unto you: ye shall not sow, neither reap that which groweth of itself in it, nor gather the grapes in it of thy vine undressed. For it is the jubile; it shall be holy unto you: ye shall eat the increase thereof out of the field. In the year of this jubile ye shall return every man unto his possession.” ~ Leviticus 25:8-13 (KJV)
If you overlay the long-term debt cycle, the short-term debt cycle and long-term economic growth, you get a chart that looks something like below (courtesy of Bridgewater Associates):

So why do long-term debt cycles exist if there are already short-term debt cycles?
It’s because all the debt that has been generated have not been entirely paid back across several business cycles. Central banks have to manage economic cycles, and the aggregate actions of market players and policy-makers typically create a leveraging phase and a deleveraging phase of the long-term debt cycle alongside the changing level of interest rates.
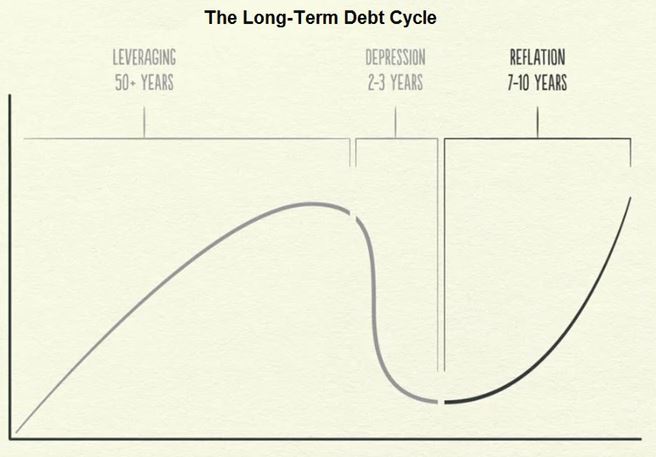
The leveraging phase of a long-term debt cycle usually takes a long time, and it usually occurs when there’s a secular decline in interest rates. Across several businesses cycles, central banks have to lower interest rates continuously in order to keep debt service costs manageable because the level of debt keeps on building up during the leveraging phase. We see this since the 1980s, throughout the 1990s and in the 2002-2007 business cycle in the US, whereby the Greenspan Fed always lowered the Fed Funds rate to a point that is lower than the lowest point in the preceding business cycle.
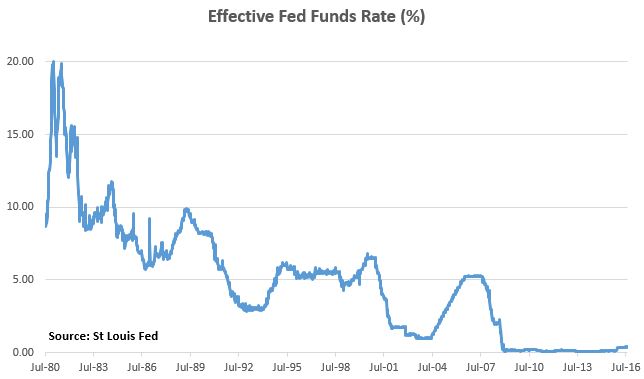
This sequence continues until rates cannot be lowered any more (they reach zero or negative). This is the apex, or a point at which a pivot in the long-term debt cycle takes place. As the chart above shows, the past 35 years since 1981 was the bulk of the leveraging phase of the long term debt cycle.
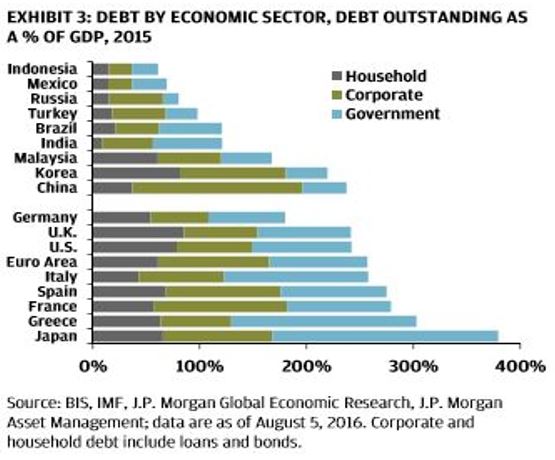
Which brings us to where we are today. We are exactly at a pivot point where central banks can no longer squeeze anymore credit growth out by making debt cheaper because interest rates are already zero (and in some places, negative), and thus a deleveraging phase in the long-term debt cycle begins. The chart below from JPMorgan shows the history of US debt as a percentage of GDP.

In other developed markets as well as in emerging markets, similar patterns are seen that suggests that we are at the pivot point of a global long-term debt cycle. The management consultancy McKinsey mentioned in a 2015 report that the world added an additional USD 57 trillion of new debt since 2008! This high level of both public and private sector debt across the world is the reason why economic growth and inflationary pressures have been sluggish – deleveraging phases of long-term debt cycles are inherently deflationary in nature.
According to Ray Dalio (founder of Bridgewater Associates), this is the main reason why all that unconventional monetary stimulus employed by central banks around the world isn’t having much of an impact on the real economy. According to Financial Times at the start of the year, Dalio wrote that:
“We are seven years into the expansion phase of the business/short-term debt cycle — which typically lasts about eight to 10 years — and near the end of the expansion phase of a long-term debt cycle, which typically lasts about 50 to 75 years.
What I am contending is that there are limits to spending growth financed by a combination of debt and money. When these limits are reached, it marks the end of the upward phase of the long-term debt cycle. In 1935, this scenario was dubbed “pushing on a string”.
Dalio says that risk premia – the return of risky assets such as bonds compared with cash – are at historically low levels.
This makes it harder for central banks to keep pushing up the prices of these assets with loose monetary policy, such as low interest rates and quantitative easing, because there is less incentive, or yield, to compensate investors for taking the risk on debt.
Here’s Dalio again:
As a result, it is difficult to push the prices of these assets up and it is easy to have them fall. And when they fall, there is a negative impact on economic growth.
When this configuration exists — and it is also the case that debt and debt service costs are high in relation to income, so that debt levels cannot be increased without reducing spending — stimulating demand is more difficult, and restraining demand is easier, than is normally the case.”
Dalio says that there are several ways that deleveraging could occur: (i) debt restructuring, (ii) austerity, (iii) wealth transfer, (iv) debt monetisation.
Historically, all four ways have been employed by entities and policy-makers. Debt reduction/restructuring and austerity is inherently deflationary while debt monetisation is inflationary. Dalio says that if there could be a healthy balance struck between various measures to delever, then ‘beautiful’ deleveragings could occur. If not, ‘ugly’ deleveragings would happen. To summarise, the following could occur:
- Ugly deflationary deleveraging – debt service costs spiral out of control, causing economic contractions and a rise in debt/income ratios alongside a decline in asset prices. Outright negative economic growth as the GDP growth rate falls below the nominal level of interest rates. Typically results in immense wealth destruction, social tensions and political regime changes (US & Japan in 1930s)
- Ugly inflationary deleveraging – too much of debt monetisation and too severe a currency devaluation which leads to a huge rise in asset prices and inflationary pressures, value of real income declines, economic growth would be boosted only in the short term (best example if Weimar Germany in 1920s)
- Beautiful deleveraging – there is enough debt monetisation to offset the deflationary forces of austerity leading to moderate economic growth, a gradual decline in debt/income ratios whereby nominal GDP growth rate is above the level of nominal interest rates
However, the sporadic and usually disorganised means of deleveraging typically resulted in social upheaval and a disruption in the global economy. Just think about the 1930s (which is the previous time the US was at a pivot of a long-term debt cycle) and the political, economic and social changes that swept across Europe and Japan. Often, there are social tensions due to the struggles between the people who own assets and those who don’t during deleveraging cycles.
Implications going forward:
Given this secular macro backdrop of a pivot point in a long-term debt cycle, it is a terrible time to be long risk assets, especially if one is a long term ‘buy & hold’ investor. In fact, it can be argued that a huge factor for the increase of income inequality as well as the huge rise in asset prices (stocks/bonds/property) in many areas of the world was due to the leveraging phase of the long-term debt cycle, as the ‘haves’ move up the social ladder rapidly due to them benefiting from a rise in asset prices and the ‘have-nots’ were being left out. The chart below shows that the inequality gap in the US coincides precisely with the long-term debt cycle.
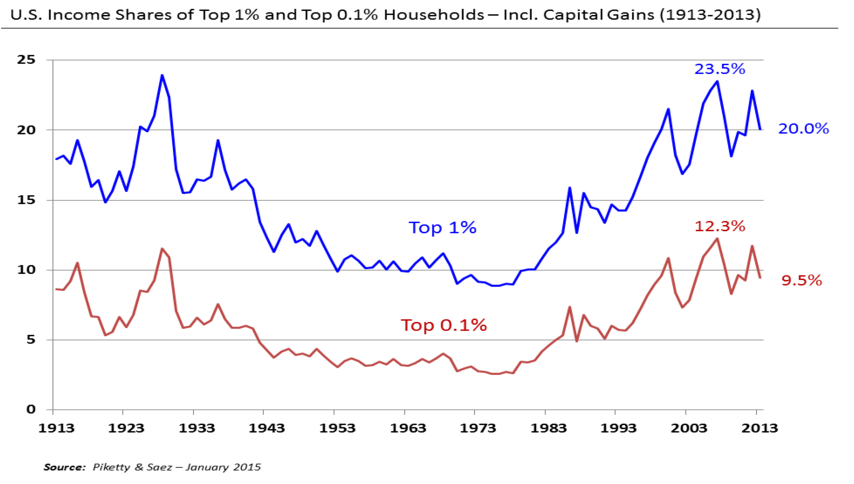
Thomas Piketty argues that the return on capital outpaced the rate of growth, so the rich got richer faster than the overall growth of the economy, creating rising inequality. However, Piketty’s thesis may be an observation of a correlation, not exactly a causative reason: the return on capital was probably boosted by the leveraging phase of the long-term debt cycle and the secular decline in interest rates. Through easier access to credit and assets (real/financial), the rich got richer faster as asset prices have been inflated on the back of continuous credit expansion.
However, since we are at the pivot point (long-term debt cycle and short term debt cycle and business cycle), betting on the party to continue is really a foolish gamble against the odds.
If you’re a long term ‘buy & hold’ investor, you should lower your exposure to risk assets like global equities and high-tier property in cosmopolitan cities across the world. In fact, when we’re done with the deleveraging phase of the long-term debt cycle, the myth that ‘property prices always go up in the long term’ would probably be badly busted, laying in its wake a trail of destruction and a shower of tears.
Owning both gold and the US dollar makes sense as policy-makers struggle to manage the deleveraging phase. Talk of ‘helicopter money’ will increase. Gold would do well if an ugly inflationary deleveraging materialises, while the USD would skyrocket if an ugly deflationary deleveraging occurs (as USD-denominated debt has to be paid back and restructured).
Additionally, we are also in a central bank bubble in this decade (as mentioned in an earlier post) as arrogant academics in their Ivory Towers try to single-handedly steer markets. With NIRP policies, continuous QE programmes, and logical fundamental relationships in financial markets breaking down, these are definitely not normal times.
There would be huge social changes as this slowly unfolds across the world as we know it, and the current political landscape already suggests shifts happening (think about the rise of nationalist movements). There will also be a tremendous amount of wealth destruction, and many entities and institutions would be caught unaware and some may even disappear entirely.
Tactical investing at this juncture would be more appropriate given the backdrop that we’re in. Volatility across asset classes would create many opportunities for the nimble investor.
The information above is something your typical banker, financial advisor or policy-maker probably wouldn’t want to tell you (assuming if they are aware of it). There are too many conflicts of interests for them to actually want you to be cognizant about it. Stay safe!
For those of you who would like to know more debt cycles and how they affect economic forces, Bridgewater’s Ray Dalio has done some very neat and intensive research – you can read it here.
*Image from http://www.missionmode.com/wp-content/uploads/2013/06/crisis-mgmt-not-bc.jpg*

I think you would enjoy reading our take on these issues as well.
http://www.valuepenguin.sg/state-global-stock-markets
http://www.valuepenguin.sg/common-factor-acquisitions-startups
http://www.valuepenguin.sg/why-us-fed-must-be-careful-interest-hike
LikeLike